Access the dashboard I created to inform this article here
If there’s been one axiom of investment since the full introduction of the fiat dollar in 1971 by Richard Nixon, it’s that gold holds value. The ultimate hedge against inflation, since 1971 gold prices are up over 1,300% in real terms, comfortably outperforming the S&P 500 over that same period. In recent months, gold’s decades-long performance has only strengthened – surging to repeated all-time highs, buoyed by persistent inflation, central bank buying, and geopolitical uncertainty.
But this begs the question – if gold is a component of the uncertainty trade, which has serious price spikes during recessions, why are periods of market optimism also met with strong gold performance? This underlies an inconvenient truth: Gold is not just (and not even primarily) an impartial hedge against risk – in the past, even without the gold standard, gold prices, both real and nominal have fallen over multiple decades. Gold is merely another asset class – albeit one with more economic history than most, and as such it will fluctuate with speculation. In recent years the emergence of gold-backed ETFs have allowed retail investors to feed gold prices with their own enthusiasm, leading gold prices to decouple from their traditional
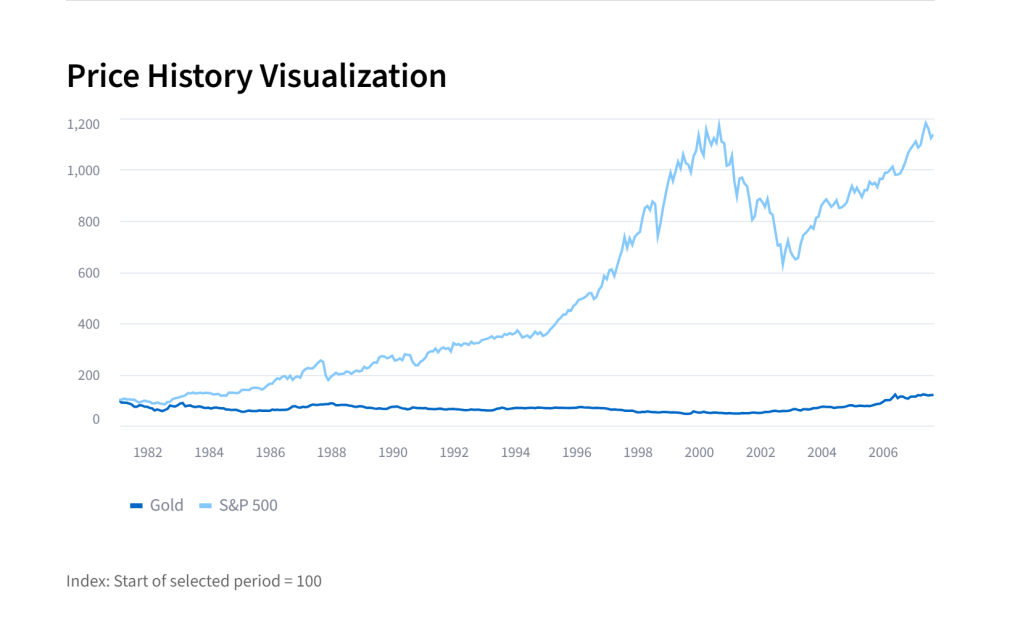
Let’s take a look at the data – I threw together a dashboard comparing the month-by-month performance of gold prices compared to American equities, which I used the S&P 500 to act as a proxy of (with hardware upgrades, I may soon be able to model at a more granular level – let me know if that’s something you’d like to see). Here’s what the overview looks like:

There’s a few periods of interest here – let’s use some preset date ranges to dive into each of them.

In this period from 1971 to mid-1980, we see the impact of the ‘Nixon Shock’, combined with the oil crises of 1973 and 1979. High resource prices weighed down on (most) company earnings, whilst the actual unpegging of the dollar from the gold standard led to a prolonged period of stagflation, causing stubbornly high inflation coupled with lacklustre economic growth. Meanwhile, in the high-inflation backdrop investors rushed to newly unleashed gold as a safe haven to protect their real earnings. During this period, central banks were reluctant to part with the vast quantities of physical gold they had amassed over the years, noting the appreciation of gold to begin with, and wishing to retain ‘reserves of last resort’ should the need for emergency currency intervention arise.
The next period – from 1981 to 2007, is where we begin to see the conventional logic of “Gold as a hedge” assert itself – when the S&P 500 grows, gold prices stayed steady – and even fell in nominal terms. From 1981 to 2001, gold prices fell by over 50% in nominal terms – in real terms the decline was even more precipitous. In contrast, the S&P 500 enjoyed a period of bumper growth, with share prices more than doubling. This is the traditional inverse of the ‘gold hedge’ theory – as equities rise, gold falls and vice-versa.
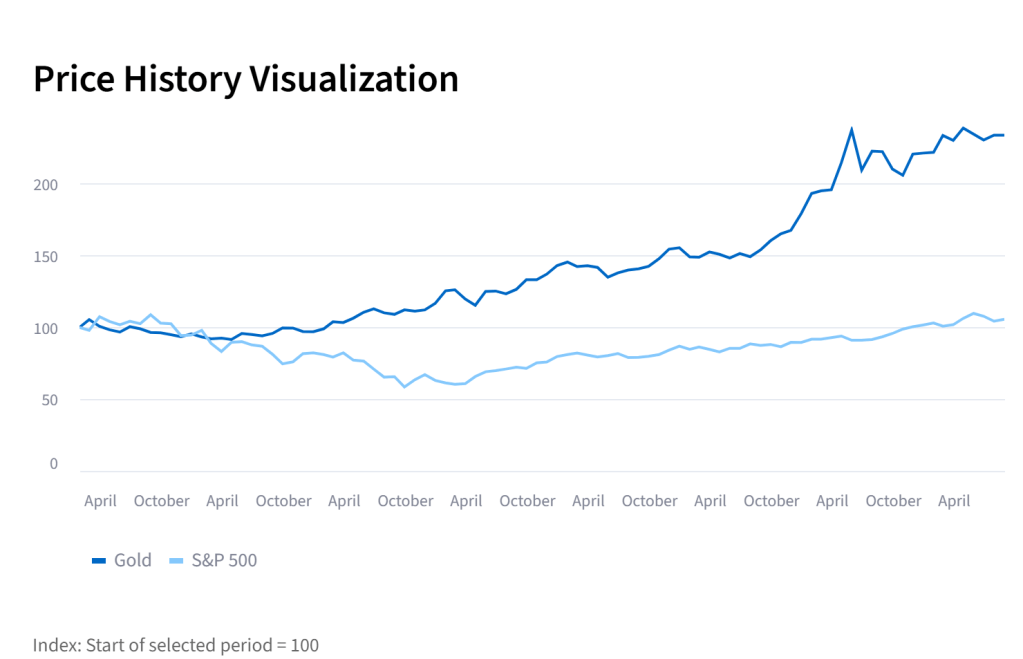
Once again, our theory is affirmed by analysing the years 2000-2007. A limp equities scene from 2001-2002 caused by the bursting of the dot-com bubble is almost perfectly mirrored by rising gold prices. However, this is where things begin to get interesting – if we examine the performance from 2003-2007, we actually start to see a positive correlation between gold and equities prices:

This can also be seen from 2023 to the present day:
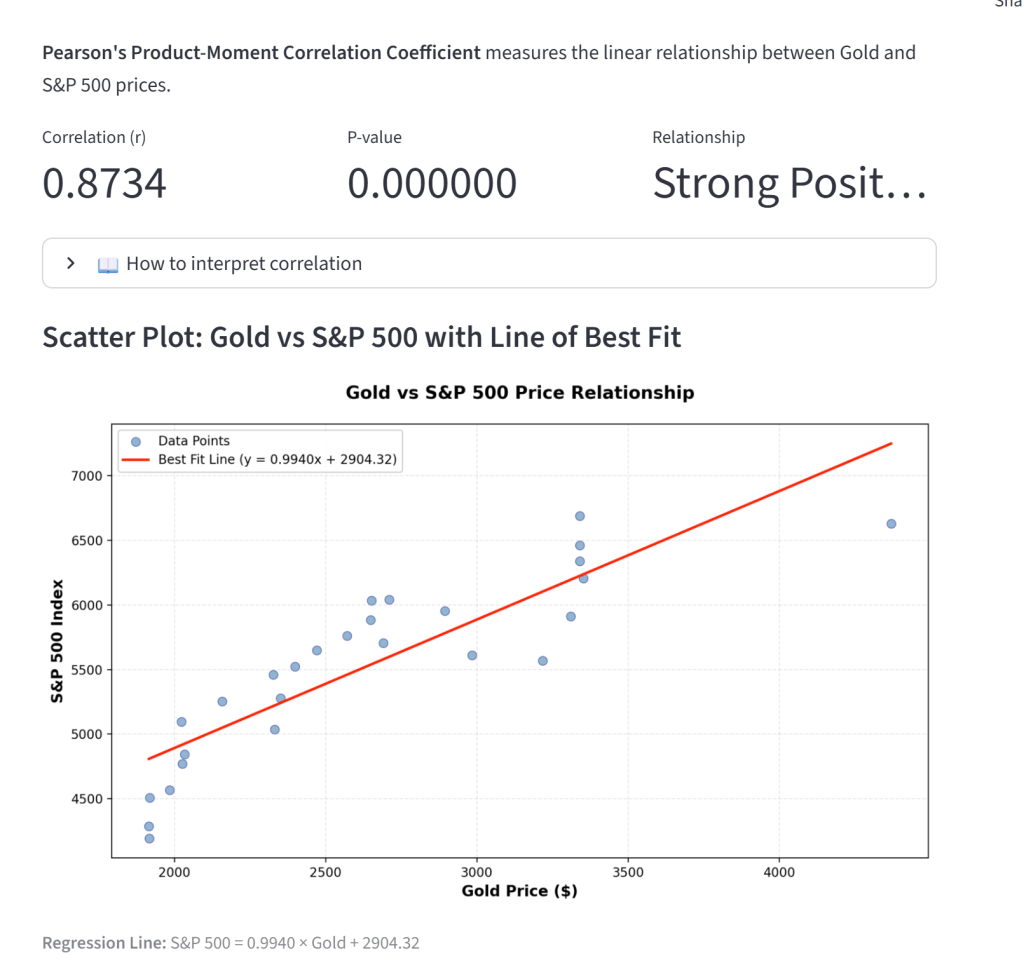
Now, these two great historical “anomalies” – when gold, the traditional hedge against equity overvaluation, moves with equity markets may indeed be revealing. In the cases of the pre-2008 positive correlation (and arguably the case today), the correlation between gold and equity prices coincided with the formation of a risky bubble – whilst equity prices skyrocketed, a dollar that weakened about 25% against other major currencies. Furthermore, rising incomes in the Western world (as well as in developing countries) fuelled significant retail demand for gold jewellery, leading to non-investor demand for that buttressed prices.
But this begs the question – is strong correlation of gold with equities a valuable indicator of bubble formation in the modern era? On the surface, this would make sense – with gold being an ‘uncertainty hedge’, one likely explanation for gold prices rising with equities could be institutional investors preparing themselves for a looming market crash . However, a different factor could well be at play – dedollarisation. Since 2022, central banks have more than doubled their annual gold purchases, from a historical average of 400-500 tonnes to about 1000 tonnes a year, primarily driven by China. This conversion of dollars to gold as alternatives to the dollar establish themselves may lead us to reach the conclusion that if the dollar is no longer accepted as a world currency, gold may very well be. The confluence of a central bank rush for gold and a boom in gold-backed ETFs in the last three years makes it nigh impossible to treat these correlations in gold prices as a serious recession indicator – even if the sudden hunger for gold by central banks may make us wonder what on earth they are preparing for – simply a gradual reduction in dollar exposure? Or perhaps something more acute?
I know this argument feels a little rough around the edges, but the truth is, there isn’t much more data I can gather. Fiat currency has only been the norm for a few decades, during which there have been just a handful of serious bubbles to analyse. The fact that in the runup to 2008 gold and equities had a marked period of correlation, which we are now seeing repeated in 2024 is certainly noteworthy – but whether history will repeat itself remains to be seen. In coming days I will update this dashboard with a more granular data overview (day-by-day instead of month-by-month), and will share any new insights that may bring.

Leave a comment