In the last few weeks and months, stocks have been surging. In spite of a murky job market, uncertain growth prospects and growing geopolitical risk. The one word that keeps being repeated by everyone is the dreaded b-word – a bubble. Fears of the AI bubble, the BNPL (Buy Now, Pay Later) bubble, and even the private credit bubble have become inescapable following each new surge in equities prices, disappointing quarterly report or high-profile bankruptcy respectively. Everyone with a stake in the markets remains painfully aware of how all too often a disconnect between investor sentiment and market realities can lead to a sharp correction.
But what causes a bubble? How are they created, who do they benefit – and how can we tell when we’re in a bubble?
The most famous early example of a bubble is that of ‘tulip mania’ from 1634-37 – a period during which the value of Dutch tulip bulbs skyrocketed amidst intense consumer interest. As tulip prices rose, speculators entered the market, creating a forward market for various types of tulip bulbs through which the implied value of tulip bulbs soared. At the peak of the bubble, a single ‘viceroy’ tulip bulb traded at a value equal to several times the cost of an average house. However, by February 1637, a lack of new buyer demand led to panic amongst speculators, and within a few short weeks the entire market unravelled.
This bubble fits the typical definition of a ‘speculative asset bubble’ – the nature of tulip bulbs as an item that can be classified by grade, stored to last multiple seasons and easily moved means it is a ‘durable good’, of the sort that could be readily traded (and speculated) on as a commodity. However, the nature of this bubble meant it was easily contained – because the tulip trade, never became truly mainstream. Tulip contracts were exchanged in casual settings in coffee houses on the edges of the Amsterdam financial world, never formally passing hands on the trading floor, as institutional players chose to stay out of what they (correctly) viewed as a period of acute overvaluation. The collapse, while dramatic, did not trigger systemic failures or widespread social unrest. This shows an important lesson: the impact of bubbles depends as much on their breadth, or the number of people with significant exposure, as it does their depth.
So what happens when a bubble is both broad and deep? An interesting place to find the answer is ancient Rome. In the first century BC, Rome’s middle eastern expansion gave it access to huge additional inflows of precious metals in the form of treasure and wealth plundered from conquered territories. This sudden influx of treasure (which in the era of coins minted from gold and silver was equivalent to an inflow of currency) massively expanded the Roman money supply. In the absence of coherent monetary policy, this high volume of currency drove interest rates down, as soldiers and merchants, newly flush with cash competed with one another for investment opportunities. A flourishing secondary market developed in land, slaves, and luxury goods, fuelled by cheap credit and easy access to liquidity. The resulting surge in asset prices bore all the hallmarks of what we today recognise as a speculative bubble: rising leverage, an expectation of perpetually increasing values, and a growing disconnect between intrinsic worth and market valuation.
As with tulip mania, the bubble’s dynamics were psychological as much as economic. The accumulation of wealth from conquest created a feedback loop of optimism — the belief that the flow of treasure would continue indefinitely. Roman elites borrowed heavily against future plunder, purchasing vast estates and funding lavish construction projects. But when expansion stalled, the inflow of new gold declined. . Property values fell, debt burdens became unsustainable, and a period of economic contraction set in.
Unlike the tulip crisis, however, the Roman bubble was systemic: it reached deep into the social and political structure of the Republic. The resulting instability undermined traditional institutions and contributed to the erosion of the smallholder class, concentrating wealth further among a few magnates. The ensuing economic inequality and social unrest paved the way for populist movements and ultimately for the fall of the Republic itself.
However, since the days of Rome (and Dutch tulips), causes of bubbles have evolved – when they arise, modern bubbles invariably are caused by faulty information (being concealed from investors like in the case of Enron), or expectations of growth that do not align with reality. However, in late stages they can be perpetuated (and exacerbated) by speculators – people who, although they know that the current values of markets are irrational, believe that they will be able to close their positions at a profit before other market participants begin to sell. Therefore, the real winners of a bubble are speculators that managed to sell their positions before a market correction, and value investors that managed to buy in before market hype took hold, and closed their positions as excessive valuations became progressively harder to be justified.
The state of the AI, private credit and Buy Now pay Later industries are each incredibly interesting, and merit their own separate articles. However, by far the most discussed of the three is AI – the productivity gains, workforce cuts and investment that transformation of the economy to integrate generative AI solutions has raised serious questions of the sustainability of valuations, and whether or not a correction is imminent. To help answer this question, let’s look at the numbers.
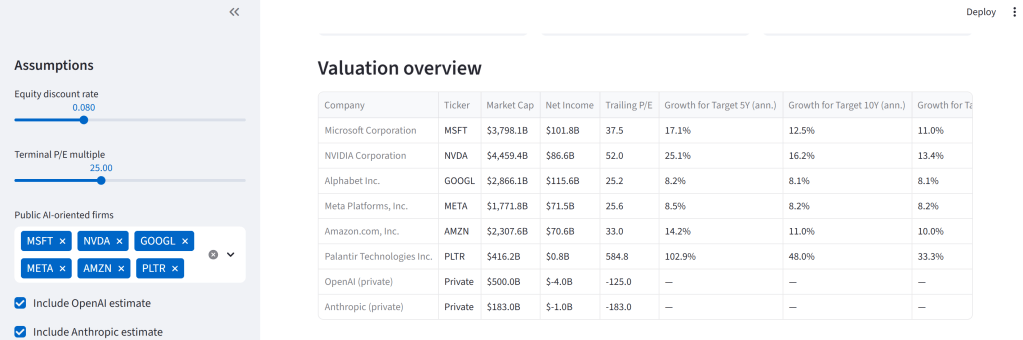
The premise of a ‘bubble’ in the modern age is clear: I built a dashboard in Python using the yfinance library and the streamlit interface to compare market caps, net income and price to earnings ratios of a group of AI exposed companies. Here’s what it looks like:
How does this help look for bubbles?
What this dashboard does is simple – it calculates the required annualised earnings growth of each of the stocks selected, to determine how fast earnings need to grow in order to justify their current valuation.
I achieved this by first calculating trailing price to earnings ratios over the last quarter. Then, I selected a terminal price to earnings ratio (or P/E multiple), which blue chip tech companies have typically remained at in recent years – 25. In case this multiple proves to be too optimistic or pessimistic, I allowed for the terminal P/E to be customisable.
Now, here’s where we determine how unrealistic these valuations are – and by extension whether these stocks are part of an AI ‘bubble’. I calculated the annualised earnings growth rate required for each of these stocks to justify their valuations over the next 5, 10 and 15 years – to achieve this we calculated the annualised rate of earnings growth required to achieve the P/E multiple we need.
Of course, this approach alone would leave us with one major issue – investors that buy stocks don’t simply buy stocks expecting their market capitalisation to remain constant – they buy stocks expecting their value to appreciate with time, meaning that the value of stocks in the future is expected to be higher than today. To account for this, I introduced a ‘discount rate’ of 8%, and modified my formulae so that required earnings growth does not only need to bring share prices in alignment with the target P/E ratio, but should also increase by the discount rate each year on top of that, in order to justify current valuations with room for sustainable growth in the future. I then allowed for three ‘reconciliation windows’ – of 5, 10 and 15 years. This allows us to determine how much annualised earnings growth would be needed in the medium to long term in order to justify current valuations – which can imply that investors with longer horizons may feel more comfortable holding AI exposed stocks through the current ‘bubble’ period based on future earnings potential.
So, what do the results show?
This is the table of results I got, using market data from the close of trading on October 10th 2025. It highlights the need for extremely high earnings growth to justify current valuations of publicly traded AI-exposed companies over the next 5 years, with the exceptions of Meta and Alphabet, which require earnings growth virtually indistinguishable from the discount rate we specified. Palantir in particular, will be required to more than double their earnings every year for the next five years to justify their current valuation (taking into account our earlier assumptions. If the trillions of dollars of AI related investments touted by each of these companies in recent years fail to meet the most optimistic wildest expectations, current valuations cannot be justified by investors with a 5 year timespan – however, longer term investors, be those young retail investors or institutional investors may have a case for continued holding of their stakes in AI exposed firms.
In all fairness, however, I recognised that this didn’t do justice to newer AI-based companies, such as Palantir. As Palantir has indeed entered a period of extremely high growth, it is reasonable that for at least the next year their earnings growth will be extremely high – a year on year growth of about 300% from 2024 to 2025 is not out of the question. I can customise my growth projections like so:
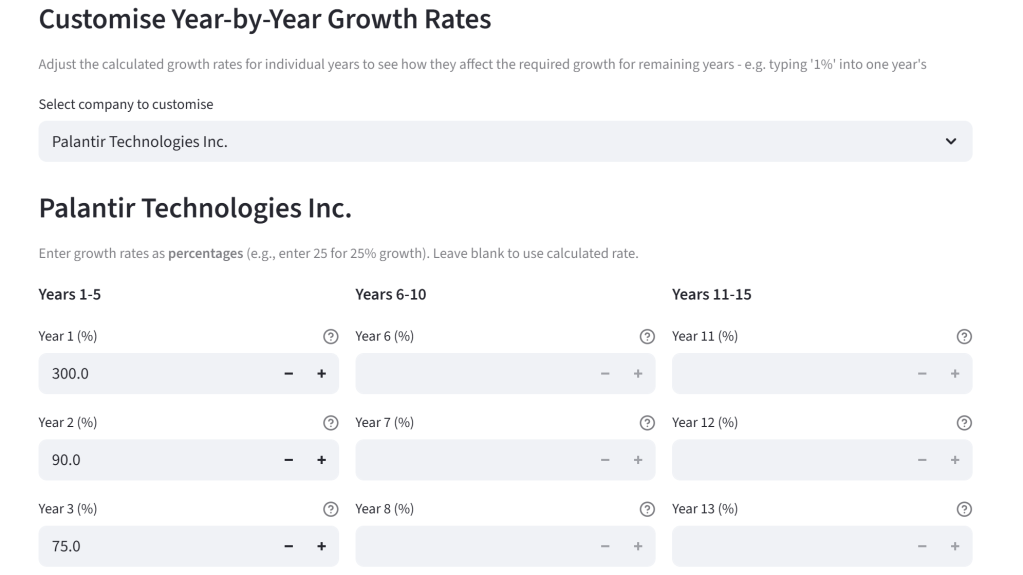
by selecting Palantir from the drop-down customisations menu, and manually adjusting their earnings growth to fit the trajectory of extremely optimistic growth over the coming three years. Then, Palantir’s annualised growth rate (which now excludes the three adjusted years) looks like this:
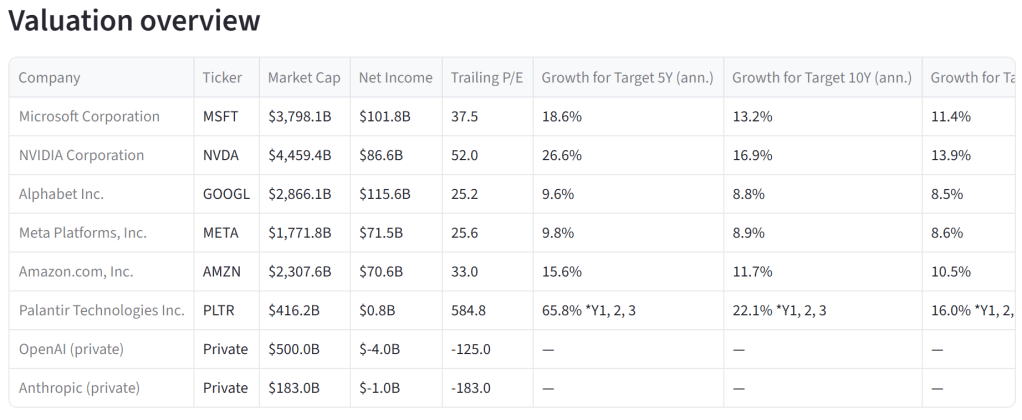
As you can see, even with these frothy expectations of Palantir earnings growth in the next three years, Palantir would still require an annualised earnings growth rate of 22% after its’ initial earnings growth ‘surge’ to justify its’ valuation within a ten-year timespan – strongly indicating that Palantir is likely to be overvalued, unless it can continue to defy gravity and exact unwavering earnings growth in the long term.
Now, these are extremely broad strokes – my assumptions on ‘terminal’ P/E ratios and discount rates are entirely qualitative, based on prior trends which may not reflect future allocations. Furthermore, my methodology only applies to publicly traded, profitable companies – the most crucial components of the AI economy (the developers of models such as OpenAI and Anthropic) continue to be lossmaking – this makes our talk about P/E and target profit growth ratios essentially meaningless. However, I still contend that my methodology is enough for us to determine that a bubble does in fact exist in the tech sector, specifically the AI sector – OpenAI’s continued cash burning despite the economies of scale they have already built up, especially when combined with the $1 trillion of investment commitments that OpenAI have maid without a clear funding plan further contributes to the narrative of an AI bubble. Whilst ‘blue-chip’ tech companies such as Amazon and Meta may continue to have strong non-Generative AI core businesses that may insulate their earnings from the broadest ‘shock’ of the bubble popping, companies such as Palantir, OpenAI and Anthropic, even if they do undergo significant earnings growth are unlikely to come close to justifying their current valuations, at least within the next 5 to 10 years.
If you like the look of my dashboard and would like to access the code I wrote to build it, so you can see how the stocks interact with your own custom growth rates, P/E targets and discount rates; or you’d like to see me flesh this out with ways to factor in raw revenue growth and cost bases, please do let me know!

Leave a comment